Developer productivity AI era measurement has fundamentally changed. Two years ago, sprint velocity and lines of code were treated as adequate proxies for engineering output. That model is now obsolete. AI coding assistants have compressed implementation time so dramatically that the old scoreboard no longer reflects what actually happened in a sprint. This is the central challenge of developer productivity in the AI era: speed has stopped being the bottleneck, so speed can no longer be the metric.
Senior developers are the ones feeling this shift most directly. You are the reviewer, the architecture owner, and increasingly, the person accountable for output you didn’t fully write yourself. Engineering leaders are rebuilding their KPI stacks around delivery metrics, review quality, incident reduction, and business impact, not because these ideas are new, but because AI has made the old shortcuts (commit counts, story points, PR volume) actively misleading.
Why Old Productivity Metrics Broke
Lines of code, commit frequency, and ticket throughput were always weak signals. AI coding tools exposed exactly how weak. A developer using an AI assistant can generate three times the code volume of a manual workflow in the same hour — without producing three times the value. Codebase churn increases. Review burden increases. None of that shows up in a dashboard built to reward raw output.
This is the core problem engineering leaders are solving for right now: developer productivity AI era tracking has to separate activity from outcome. A team that ships fast but generates a wave of incidents two sprints later has not become more productive. It has moved the cost downstream, where it is harder to attribute and more expensive to fix.
There’s also a subtler distortion at play. When code generation is nearly instantaneous, the visible part of engineering work – commits, PRs opened, tickets closed stops correlating with the invisible part: thinking through edge cases, validating assumptions, and deciding whether a piece of AI-generated logic actually belongs in the system. Dashboards built around the visible part are now measuring the least differentiating 20% of the job. That’s why so many engineering leaders describe their old scorecards as “actively misleading” rather than simply “outdated” – the old numbers don’t just fail to capture value, they can reward the wrong behavior outright.
The Four Pillars of Modern Engineering Measurement
Most engineering organizations rebuilding their measurement systems for the developer productivity AI era are converging on four pillars: delivery metrics, review quality, incident reduction, and business impact. Each compensates for a blind spot in the others.
1. Delivery Metrics – Speed With Context
Delivery metrics are still relevant, but they’ve matured beyond simple velocity counts. The DORA metrics – deployment frequency, lead time for changes, change failure rate, and mean time to recovery- remain the backbone of most delivery dashboards, largely because they were designed to resist gaming. A team can’t inflate deployment frequency without also being accountable for change failure rate.
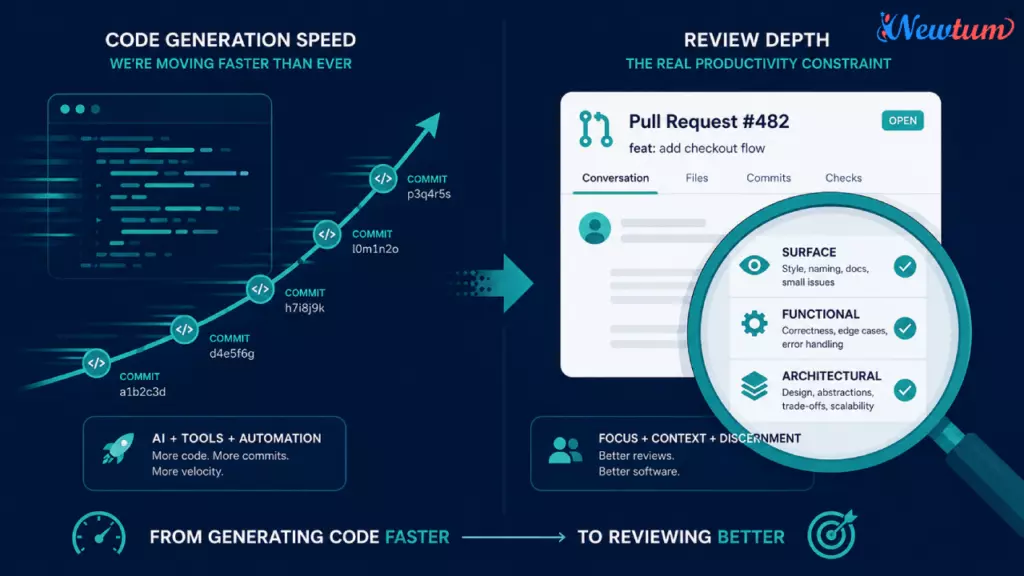
What has changed under a developer productivity AI era model is the addition of a fifth signal: AI-adjusted cycle time. This measures how long a ticket takes from “AI draft generated” to “merged to main,” isolating the review and validation phase from the generation phase. Teams that only track total cycle time miss the fact that generation time has collapsed while review time has, in many cases, stayed flat or grown. Cycle time alone can look flattering while hiding a genuine bottleneck sitting in code review.
Some organizations are going a step further and splitting delivery metrics by task category – bug fixes, new features, refactors- because AI assistance compresses each category by a different margin. A team’s average cycle time can improve simply because more of the sprint’s work shifted toward AI-favorable task types, not because engineers actually got faster at the hard parts. Segmenting delivery data this way keeps leadership from drawing false conclusions from an aggregate number.
2. Review Quality – The New Center of Gravity
If code generation is no longer the constraint, review has become the actual engineering work. This is arguably the single biggest shift in developer productivity AI era, and it’s why senior developers now spend a disproportionate share of their week reviewing rather than writing.
Companies measuring review quality track a combination of signals: review turnaround time, defect escape rate (bugs that make it past review into production), rework rate (how often merged code is reverted or substantially patched within two weeks), and reviewer depth — a qualitative signal usually captured through structured review rubrics rather than raw approval counts. A rubber-stamp approval on AI-generated code counts the same as a thorough review in a naive dashboard, which is exactly why leading teams are moving away from binary approve/reject tracking and toward tiered review classifications: surface-level, functional, and architectural.
A growing number of platform teams are also instrumenting review comments themselves, tagging whether feedback addresses style, logic, or architecture. A PR with ten style comments and zero logic comments tells a very different story than one with two comments that each catch a genuine architectural mismatch. This kind of tagging is still manual in most organizations, but a few are experimenting with AI-assisted comment classification to make the signal cheap enough to track at scale without adding overhead to the reviewer’s actual workflow.
3. Incident Reduction – Where the Real Cost Shows Up
Incidents are the lagging indicator that tells you whether your delivery and review metrics were actually measuring the right thing. In a developer productivity AI era framework, incident data gets segmented by origin: was the root cause in AI-generated code, human-written code, or a review gap where AI output wasn’t adequately scrutinized?
This segmentation matters because it closes the loop between fast shipping and downstream cost. Teams tracking mean time to detect (MTTD), mean time to resolve (MTTR), and incident recurrence rate by code origin get a much clearer picture of whether their AI-assisted workflow is net-positive. A team that ships 40% faster but doubles its P1 incident rate hasn’t improved productivity; it has shifted effort from writing code to firefighting, usually at a worse exchange rate.
The most useful version of this tracking also captures severity trend over time, not just incident count. A rising number of low-severity incidents caused by AI-generated edge case gaps is a manageable signal; it points to a review checklist gap that’s fixable in a sprint. A rising number of high-severity incidents traced back to AI-generated logic that passed review unquestioned is a governance problem, and it usually means the review-depth tiers described above aren’t being enforced consistently across the team.
4. Business Impact – Closing the Loop
The final and most difficult pillar to measure is business impact: does faster, AI-assisted delivery actually move revenue, retention, or cost metrics that the business cares about? This is where most developer productivity AI era measurement programs are still immature, because it requires product and engineering data to be joined in ways most organizations haven’t built yet.
The organizations doing this well are tracking feature-to-revenue attribution, customer-reported defect rates post-release, and engineering cost per shipped feature (factoring in AI tooling spend, which has become a real budget line item). This last point matters more than it might seem: token-based AI tooling costs have grown fast enough at some companies that raw throughput gains were partially or fully offset by tooling spend, meaning the “productivity win” existed on a delivery dashboard but not on a P&L.
Learn What are The Irreplaceable Engineer: 6 Things AI Will Never Take from You
A Framework for Structuring the Scorecard
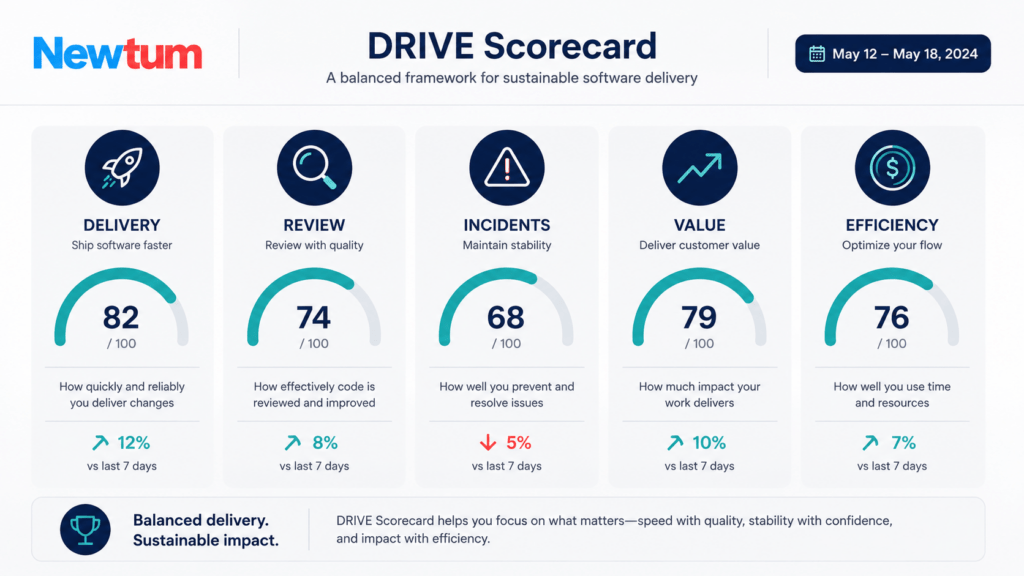
To help engineering leaders operationalize this shift, a useful structure is the DRIVE Scorecard – Delivery, Review, Incidents, Value, Efficiency. It’s a practical way to organize the four pillars above into a single reporting layer that senior developers and engineering managers can actually use in planning conversations, rather than a scattered set of disconnected dashboards.
- Delivery – cycle time, AI-adjusted cycle time, deployment frequency
- Review – turnaround time, defect escape rate, review depth tier
- Incidents – MTTR, MTTD, incident origin (AI vs. human vs. review gap)
- Value – feature-to-revenue attribution, customer-reported defect rate
- Efficiency – cost per shipped feature, including AI tooling spend
Framing measurement this way keeps the conversation honest. A team that scores well on Delivery but poorly on Incidents and Efficiency isn’t a productivity success story – it’s a team that needs a review process upgrade before its numbers can be trusted.
How the Data Actually Gets Collected
None of this works without instrumentation, and most engineering organizations are stitching it together from tools they already own rather than buying a single new platform. Git and CI/CD data (commit metadata, PR timestamps, deployment logs) feed delivery metrics. Code review platforms supply turnaround time and, increasingly, structured rubric scores. Incident management tools (PagerDuty, Opsgenie, or an internal equivalent) supply MTTR and MTTD, tagged against a code-origin field that engineering teams now have to actively populate — it doesn’t exist by default in most systems.
The business impact layer is the hardest to automate because it requires a join between engineering systems and product analytics that few companies had built before AI made it necessary. Feature flags mapped to revenue cohorts, support ticket volume tagged by feature, and cost dashboards pulling from AI vendor billing APIs are the three data sources doing the most work here. Teams that haven’t built this pipeline yet are, in practice, still measuring engineering output through delivery and review data alone – which is a reasonable starting point, but an incomplete picture.
What This Means for Senior Developers Specifically
If you’re a senior developer, this measurement shift changes what “being productive” looks like day to day. Under a developer productivity AI era model, your value is measured less by how much code you personally generate and more by:
- Review throughput without quality loss – can you review AI-assisted PRs from your team at a pace that doesn’t create a bottleneck, while still catching architectural and security issues?
- Incident prevention, not just incident response – are you catching the categories of AI-generated bugs (hallucinated APIs, subtle logic errors, missing edge case handling) before they merge?
- Mentorship and standards ownership – are you the person establishing the review rubrics, AI usage guidelines, and escalation paths that let junior developers use AI safely?
- Judgment calls on AI-generated architecture – does the code fit the system, not just pass tests?
None of these show up on a commit graph. That’s precisely why engineering leaders measuring developer productivity AI era outcomes are shifting performance conversations away from raw output and toward these harder-to-game, higher-leverage signals.
Common Measurement Mistakes Companies Are Making
A few patterns show up repeatedly in organizations still using pre-AI measurement systems:
- Rewarding AI-assisted volume as if it were skill.
Story points completed per sprint went up because generation got faster, not because engineers got better. Leaders who don’t separate these two signals end up promoting on the wrong criteria. - Treating review time as pure overhead.
Some organizations have tried to compress review cycles to match the speed of AI code generation, which just moves defects downstream into incidents – the opposite of the intended outcome. - Ignoring AI tooling cost in productivity math.
A “faster” team that costs three times more in AI tokens per feature shipped isn’t obviously more efficient. Any developer productivity AI era measurement program that excludes tooling spend from the efficiency side of the ledger is incomplete. - Measuring individuals instead of systems.
Because AI assistance varies by task type, comparing individual developers on raw throughput is noisier than ever. Team-level and system-level metrics (cycle time, incident rate, review depth) are far more stable and far harder to game than individual scorecards.
Where This Is Headed
Expect the next stage of developer productivity AI era measurement to formalize further, with review-quality tooling (structured rubrics embedded directly into PR workflows) and incident-origin tagging becoming standard practice rather than a mature-team differentiator. Engineering leaders who build this measurement discipline now before it becomes a board-level expectation will be the ones setting the benchmark that other companies get measured against.
The bottom line: AI didn’t make developer productivity easier to measure. It made the old proxies for productivity meaningless and forced companies to build a more honest, outcome-anchored scorecard. For senior developers, that’s ultimately a better trade: your judgment, review depth, and system-level thinking are now the metrics that matter, and those are things that couldn’t be faked by a fast autocomplete in the first place. Learn How to Adapt AI with Newtum for a better Career.
FAQ – Developer Productivity AI Era
What is developer productivity AI era measurement?
It refers to the updated set of engineering KPIs – delivery metrics, review quality, incident reduction, and business impact that companies use to evaluate engineering output now that AI tools have changed how fast code gets written.
Why don’t commit counts and lines of code work anymore?
AI coding assistants inflate raw output volume without a proportional increase in value delivered, making output-based metrics unreliable and easy to game.
What’s the single most important new metric?
Most engineering leaders point to incident origin tracking (AI-generated vs. human-written vs. review-gap) as the metric that most clearly separates genuine productivity gains from deferred technical debt.
How should senior developers position themselves under this shift?
Focus on review depth, incident prevention, and system-level judgment – the parts of engineering work that AI still can’t replace and that increasingly define performance evaluations.